I suspect that the challenges you are encountering when trying to replicate published estimates stem from both how IPUMS constructs the MET* variables as well as changes introduced in geography in the 2022 ACS. I’ll explain how we construct these variables, describe the change in 2022, and suggest some alternative approaches.
Due to respondent confidentiality protections, the ACS Public Use Microdata Sample (PUMS) data does not identify the metropolitan area of residence for respondent households. Instead, the Public Use Microdata Area (PUMA) of residence is reported. This is not the case with the ACS summary data tables, which report geographically aggregated statistics for many different divisions (including MSAs). IPUMS research staff create variables that identify MSAs where possible (MET2013, MET2023) in the PUMS data by comparing PUMA and MSA boundaries. However, the overlap between these boundaries is often imperfect. As detailed in the description tab for MET2013:
MET2013 cannot identify the exact set of households residing in every metro area.
The protocol used by MET2013 is to identify the metro area in which the majority of each PUMA’s population resided. If MET2013 identifies a metro area for a given household, it indicates that, for the PUMA where the household resided, a majority of the PUMA’s population resided in the identified metro area.
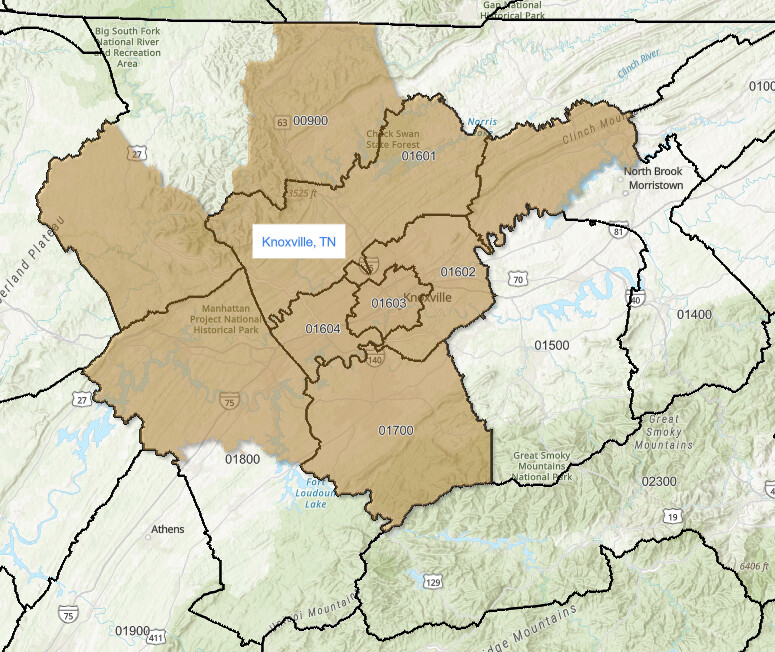
Our assignment protocol yields both errors where residents of an MSA are excluded from the MSA (omission error) and where non-residents of an MSA are included (commission error). We document the incongruencies between PUMA boundaries and metro boundaries (e.g., see the MSA 2013 to PUMA 2010 crosswalk). As an example, below is a screenshot of the map of 2010-vintage PUMA boundaries (in black) matched over the Knoxville metro area (in tan):
As detailed in the MSA 2013 to PUMA 2010 crosswalk, seven of the eight PUMAs within the metro area have a majority of their population within the MSA (900, 1601, 1602, 1603, 1604, 1700, and 1800); therefore, these seven PUMAs are used to represent the Knoxville metro area in the 2012-2021 samples. PUMA 1400, having less than 50% of its population within the metro area, is excluded. The portion of Knoxville residents who reside in PUMA 1400 (2.7%) comprise the MSA’s omission error. The portions of PUMAs 900 and 1800 that are outside the MSA (11.5% of the total population) comprise the MSA’s commission error. Our threshold for summer match errors (e.g., omission + comission error) is 15%. Because the sum of these match errors totals 14.2%, we will identify Knoxville.
Beginning in 2022, the PUMAs in the ACS data were updated based on the 2020 decennial census. These boundaries may differ from the previous PUMAs and, therefore, may have different relationships to the MSA boundaries.
There are a couple of alternatives that you may consider in your analysis:
-
If you do not require individual-level microdata, then the ACS summary data tables on IPUMS NHGIS may be more helpful. Since individual-level information is not reported in the summary data, the same identification issues are not at play. Estimates for a particular MSA will reflect the contemporaneous MSA boundaries. Using the data finder tool, you can apply filters to search for the data tables that are of interest to you.
-
If you want to continue using the PUMS data from IPUMS USA, you can download the 2023 5-year ACS sample for your analysis. With this sample, the Census Bureau reports only the 2020 vintage PUMA boundaries for all survey years included in the file (i.e., while the 2019-2021 ACS was fielded using 2010 vintage PUMAs, the 2023 5-year file reports PUMAs using the 2020 vintage). This will retain the imperfect identification of the metro area, but will keep the PUMA:MSA relationships consistent across the five-year study period.