I want to use the distribution of family income by race at the tract-level to calculate a measure of income segregation in metro areas by race between 1970 and 2000. I’ve identified the correct data tables for 1970, 1980, and 2000, but I can’t figure out where the table for 1990 is. I understand that racial breakdowns were not included in the summary tape files 3 in 1990, but previous research has said they found this measure at the tract-level in the summary tape files 4a in 1990. STF 4a (as well as 4b) on IPUMS doesn’t have tract-level tables available, though. Am I missing something, or is the table I’m looking for in 1990 simply not available?
Tract data are available in IPUMS NHGIS 1990 STF 4 datasets, but not via the “standard” tract geographic level.
At the standard census tract level, each data record corresponds to a single, whole tract. NHGIS identifies this level as “Census Tract (by State–County)”.
The original 1990 STF4 files supply no data at the standard tract level. Instead, STF4 provides data for two “compound” tract levels:
-
“Census Tract/Block Numbering Area (by State–County–Metropolitan Statistical Area/Consolidated Metropolitan Statistical Area/Remainder–Primary Metropolitan Statistical Area/Remainder)”
-
“Census Tract/Block Numbering Area (by State–Metropolitan Statistical Area/Consolidated Metropolitan Statistical Area/Remainder–Primary Metropolitan Statistical Area/Remainder–County–Place [10000 or more persons]/Remainder)”
For the first of these levels, nearly all of the data records describe whole tracts, except for a few cases in New England where a single tract straddles metropolitan area boundaries. In those cases, there are separate data records for the parts of the tract lying in each metro area. (The second compound tract level in 1990 STF4 divides tracts by metro area boundaries _and_ by place boundaries, so it includes many more tract subparts. If you’d prefer whole-tract data, the first level is a better starting point.)
To find compound levels in the NHGIS Data Finder, click on SHOW COMPOUND LEVELS in the upper right of any geographic level selection window.
(If you’re in the GEOGRAPHIC LEVELS Filter pop up, you’ll also need to select a non-default category of geographic levels on the left. The default selection of MOST POPULAR omits compound levels. The ALL and SMALL AREA STATISTICAL UNITS categories include compound tract levels.)
Also, if you ever want to know which geographic levels are covered in a particular NHGIS dataset, first find a table from that dataset in the SELECT DATA grid, and then click on the dataset code in the YEAR - DATASET column. A DATASET DETAILS window will pop up that lists (among other things) all geographic levels available for the dataset, including compound levels.
Hello, I wanted to ask a follow-up to this question about race by income data at the tract level in the ACS. I was able to find these breakdowns for the 1970-2000 decennial Censuses, but not for later years. Is that correct, that the ACS doesn’t publish race x income breakdowns at the Census tract scale, perhaps because of the smaller sample size? Thank you!
The Census Bureau has published a similar ACS product, including income tables for detailed race groups, but we haven’t yet added these to NHGIS. The Bureau calls these tables “Selected Population Tables (Race, Ethnicity, Ancestry)”, and here’s the product page. They’re released less frequently than other ACS products, so currently, there are tables for only three periods: 2006-2010, 2011-2015, and 2017-2021.
Adding these tables to NHGIS is part of one of our current grants. I appreciate hearing your interest in them; it’s added motivation to get this done! But it may yet be a year or two.
Hello,
Can you please identify the table or variable name for family income by race at the tract-level for Census 1990? I filtered the data as specified above, but I still cannot locate the variable.
Thank you,
Robert
As indicated by the full name of the NHGIS 1990_STF4b dataset (“Sample-Based Detailed Data with Race/Ethnicity Breakdown”), this dataset has a “race/ethnicity breakdown”. This means that if you get any table in this dataset, you can choose to get the table further broken down by specific race and ethnicity groups.
For more background about breakdowns, see this general explanation of breakdowns on the NHGIS FAQs page.
In the NHGIS Data Finder, if you use the Topics filter, you’ll see there are both “Table Topic Filters” and “Breakdown Filters”. In the example below, I’ve selected the “Race” breakdown filter, along with a table topic filter for Household and Family Income.

Then I selected a Years filter for 1990, and I sorted the list of Source Tables by Popularity. I see that the third listed table is NPB86. Family Income in 1989 by Family Type and Presence and Age of Children, and the fifth listed table is NPB88A. Median Family Income in 1989…
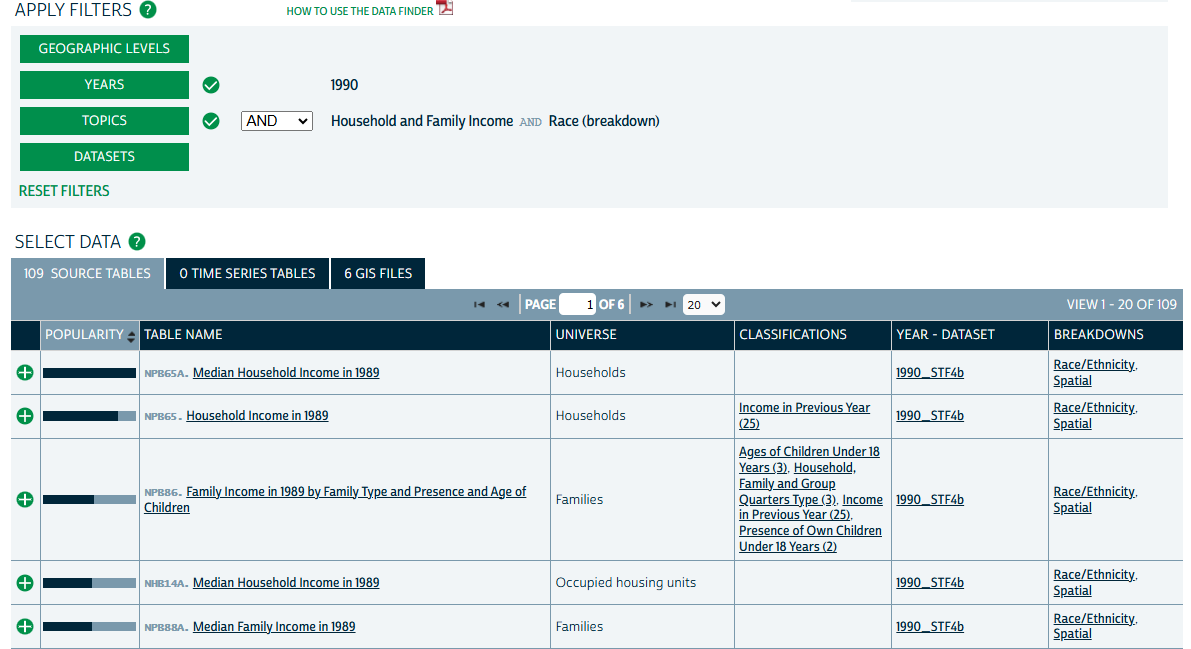
You can also see in the rightmost column that these tables both have a Race/Ethnicity breakdown and a Spatial breakdown. If you add these tables to your Data Cart and proceed to the Options page, you’ll be able to select specific races and/or ethnicities that you’d like to get data for by clicking on “Race/Ethnicity” under the BREAKDOWNS heading:

Importantly, (as noted in the FAQ) when the Census Bureau produces datasets with breakdowns like this, they typically suppress data for cases with very small sample sizes, i.e., where a specific geographic unit has a very low population count for a specific identified population group, and they may use top-coding and bottom-coding to avoid identifying exceptionally low or high median incomes. You might be able to find more information about the strategies used in the 1990 STF4 data in the corresponding technical documentation.
That worked. Thanks so much for the thorough reply!