I’m trying to analyze the reasons that people leave the New York-New Jersey metro area (METFIPS=35620) for another state (MIGRATE1=5) and I’m finding that the WHYMOVE variable in the AESEC within CPS is incredibly volatile. I know that this is a smaller sample size, and as we drill down into more granular geographic areas, we’ll get some volatility, but these numbers seem really wild. Can anyone offer any context here or an alternative?
whymove (4).csv (6.3 KB)
First, by using METFIPS you are capturing current residence, not previous residence. In your example, you would be looking at why people moved who currently live in METFIPS=35620. Unfortunately the CPS BMS does not capture previous location of residence, 1 year prior. The ASEC does capture previous residence, but only at the state level (MIGSTA1).
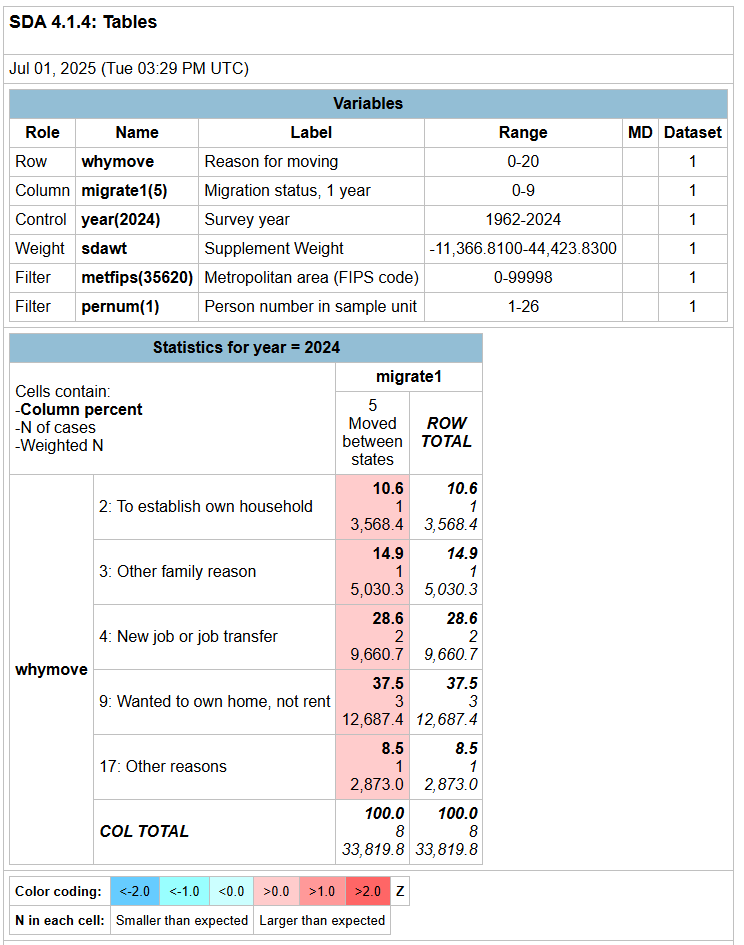
Furthermore, the volatility you are seeing when using these filters is the result of extremely small sample sizes. It appears that you are using SDA based on your CSV output. If you select to include Unweighted Ns (under the Output Options accordion menu) in your SDA output, you will see that in between 2020 and 2024 in the ASEC, there are less than 20 total respondents per year with data for WHYMOVE for those reporting MIGRATE1==5. In the first screenshot below which includes the 2024 ASEC, there are only 8 respondents with a code of MIGRATE1==5. It is generally not advisable to rely on analyses with this small of sample sizes.
As an alternative, I would recommend using the ACS through IPUMS USA. While the ACS doesn’t ask for the reason a person moved, it does include variables that capture transitions in the past year that map onto the reasons provided in the CPS ASEC WHYMOVE variable. For example, you could use MARRINYR (Married in past year), FERTYR (Child born within last year) and WORKEDYR (Work status, past year), among others. The ACS will have substantially larger sample sizes in addition to more detailed migration variables. Some of these more detailed migration variables that you will likely need to use (such as MIGMET131) are not available through SDA and you will need to create a data extract for your analysis. As a note, if you are looking primarily at people who moved OUT of the NYC metro, you will need to use a variable such as MIGMET131 (Metropolitan area of residence, 1 year ago) or MIGPUMA1 (PUMA of residence, 1 year ago). If you use METFIPS(or in your ASEC example, METFIPS), that would reflect where they CURRENTLY live. I created an extract (see second screenshot below) and did some simple tabs, and the unweighted sample size of ACS respondents who moved out of NYC MSA (but not within the MSA) in the 2023 ACS was 5,413. You could pool multiple years of the ACS or use the 5 year ACS sample to increase your sample size.
Screenshot 1: SDA output showing migration status 1 year ago if they moved between states (MIGRATE1==5) and their reason for moving (WHYMOVE). The middle number in the red highlighted cells shows the unweighted case count with each cell containing less than 10 cases.
Screenshot 2: Stata output of 2023 ACS data (SAMPLE==202301) showing current US region of residence (REGION) and Migration status 1 year ago (MIGRATE1) if the respondent previously lived in the NYC MSA (MIGMET131==35620) but does not currently live in the NYC MSA (MET2013!=35620).
Dan,
I am always blown away by the depth of expertise over there. Thanks so much for your help. Indeed I had set the metro variable incorrectly (I usually do this with large IPUMS downloads), and your trick for revealing the sample size is super helpful. Thanks so much.
You got it! I noticed my screenshots weren’t displaying properly so I hope my edit has that fixed now.