Hi IPUMS,
I successfully recreated ACS Table B19126 using 2019 - 2023 5-year PUMS with weighted interpolation and the Census methodology, it falls within the MOEs.
But when I apply the same method to 2014 - 2018 or 2009- 2013, the values for subgroups like married-couple families with own children don’t fall within the published MOEs.
I’ve used HHT, NOC, and adjusted FINCP correctly (I believe), but something’s still off. Has anyone here recreated B19126 for earlier 5-year files? Would love to know if there’s something I’m missing – maybe changes in variable definitions or universe?
Thanks in advance!
It’s common for ACS summary table estimates and those derived from the public use microdata to slightly differ. Several factors contribute to this, including the fact that the public-use file is a subset (about 2/3) of the full restricted use dataset. In the case of income variables, differences can be more pronounced due to topcoding in the public data. This is especially relevant for aggregate income measures like FINCP, which is calculated by summing the income components of each family member (each of which is individually topcoded). As a result, income estimates in the PUMS can diverge from those in the published tables, sometimes even falling outside the reported margin of error.
Regarding the effect of changes to family definitions, one possibility might be that this is caused by changes in the relationship to householder variables over time. In 2019, the Census Bureau added some more clarity to the spouse/partner response categories that may have resulted in less data editing and fewer reporting errors (see this PRB overview). Additionally, the 2009-2013 data may be impacted by the inclusion of same-sex married couples (in the 2013 data only). I am unsure how the multi-year summary files handle these changes; it may be that the tables implement the change for all years while in the PUMS the change is only applied to the years after it is implemented.
It would be helpful to know your specific estimates for the 2013 and/or 2018 files to better understand the extent of the discrepancy. You might also consider calculating confidence intervals for your PUMS-based estimates using replicate weights (see REPWT). Even if your point estimates fall outside the published MOEs, there may still be overlap between the confidence intervals derived from the microdata and those in the published tables when using replicate weights.
Thank you for the detailed explanation. As you suggested, I pulled together my interpolated medians for the earlier ACS 5-year files so you can see the extent of the discrepancies.
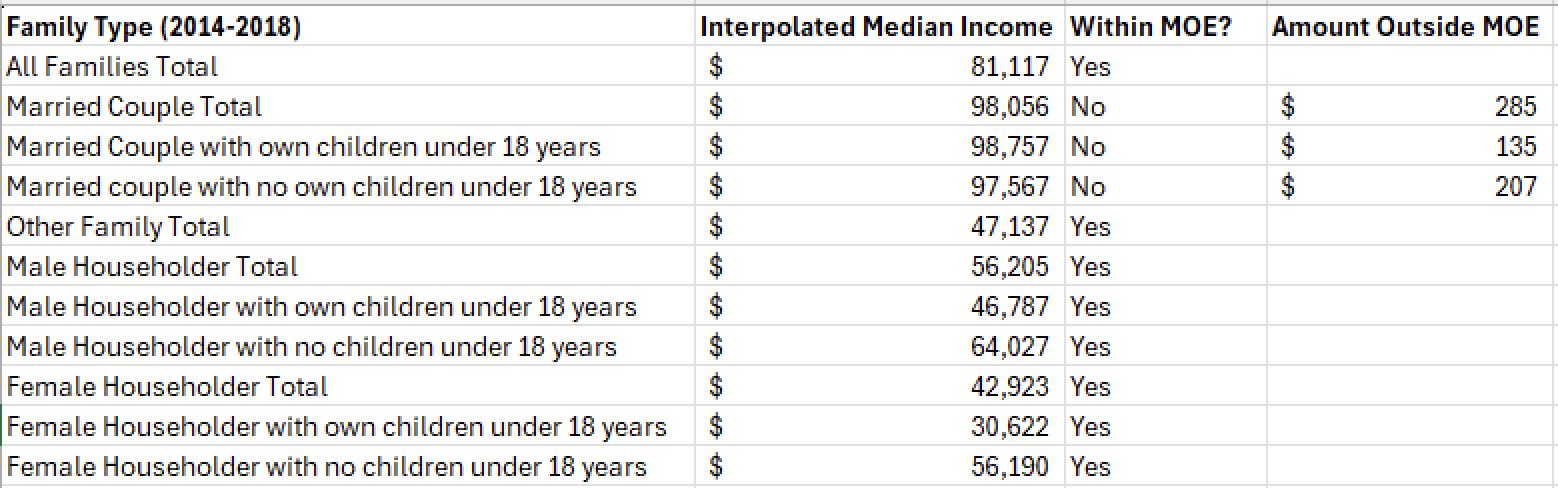
Here are my results for the 2009-2013 and 2014-2018 files. I included a column showing the Amount Outside MOE when the estimates fall beyond the published margin of error.
Most groups fall within the MOEs, but married couple families, especially those with own children under 18, consistently land outside. The differences range from about $73 to $285, which is small but still beyond the MOEs.
I will be using replicate weights (REPWT) to calculate confidence intervals and check whether they overlap with the published estimates, even when the point estimates fall outside the MOEs.
Does this pattern seem consistent with the topcoding and definitional changes you mentioned, such as the adjustments in spouse and partner categories and the inclusion of same-sex married couples?
Thank you again for your guidance!
Thank you for sharing these figures with your results. As you note, while these estimates are outside of the margin of error, they are not very far outside. It is up to each individual researcher to determine if their estimates are reasonable or not, but I assume that these differences are likely the result of the summary tables being generated using the restricted file. In addition to the restricted file containing more observations and income values that are not topcoded, the restricted file also contains unrounded income values. For example, wage income (INCWAGE) is rounded in the ACS PUMS to the nearest $1,000 for wages above $50,000. The margins of error incorporate the effects of non-random sampling, but they are unable to consider edits to the data such as rounding.
In addition to the change in 2013 that ceased recoding same-sex married couples as unmarried partners, the ACS also underwent a change in 2019 when the survey began including “same-sex” and “opposite-sex” identifiers for spouses and unmarried couples.
While the individual level microdata allows researchers to run complex multivariate analyses, there are also limitations. Without more context on your research agenda, I will suggest that if you do not require individual-level data, then the ACS tables on IPUMS NHGIS may be more suited to your research.