Question about weighting and proportion estimation in the ACS

Hi there, just writing with a (hopefully) straightforward question about weighting in the 2013 ACS.

I have 2 ways that I’ve tried to estimate the proportion of households that live near good schools, according to a variable I’ve created with data I merged into the ACS at the PUMA level, captured in the variable “deprived_of_good_ed,” which is either 0 or 1. 1 means “deprived”; 0 means “not deprived, there are decent schools in the PUMA.” This variable is a little goofy, but please humor me, this question isn’t about goofy measurement of access to good schools.

Anyhow, I’m trying to tab this at the household level, for households with heads between 25 and 54, by race.

So: here’s the first way I’ve tried to do this.

tab deprived_of_good_ed if relate==1 & (age >24 & age <55) & race==2 [w=hhwt]

tab deprived_of_good_ed if relate==1 & (age >24 & age <55) & race==1 [w=hhwt]

It creates an output that looks like “output 1,” attached. It tabs black households (race==2), then white households (race==1)

Is that an acceptable way to estimate these proportions?

If not, is the way below acceptable:

gen target_group = 0

replace target_group = 1 if relate==1 & (age >24 & age <55)

svyset serial [pweight=hhwt], vce(linearized)

svy, subpop(target_group): mean deprived_of_good_ed, over(race)

This creates an output that looks like “output 2,” attached.

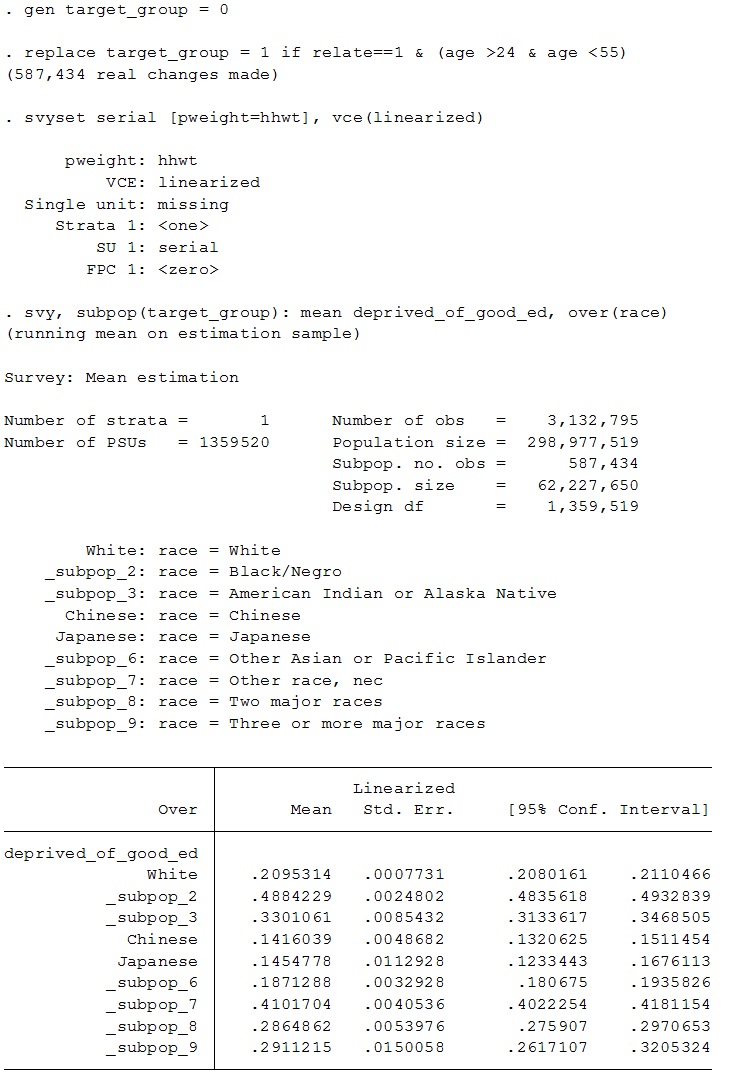
These estimates, I notice, are somewhat different. Eager to hear which are correct–which method above is correct–or if I need to do something different entirely.

Thanks as always!

I see 0.2095 and 0.4884 in both outputs. Where do you think the estimates are “somewhat different”?

The tab with frequency weights is a wrong approach. It may give the same point estimate, but it does not even attempt to produce a standard error.

Your -svyset- should use the SDR replicate weights instead of linearization (which is most likely underestimating the standard errors).

-svy- output provides a number of additional helpful checks. The population size of 289M seems close enough to the size of the U.S. population, although the current number is creater than that. Does the subpopulation size of 62M households seem right to you? This is about half of all the household in the U.S., which may be about right. If you want to concentrate on households with children, you need to create your subpopulation more explicitly, e.g.,

egen has_kids = max( inrange(age,0,17) ), by(serial)

Ah, sorry was looking at the wrong row for the point estimates.

Quick follow-up question (if I can ask that here). Are there any advantages to using the Strata and Cluster variables, as opposed to the replicate weights? I notice that there’s some description of this on this page (https://usa.ipums.org/usa/complex_sur…)

which gives commands like this:

svyset cluster [pweight=perwt], ///


strata(strata) svy, subpop(if age >= 65): mean var1


Do these produce confidence intervals as well?


If so, will they be similarly under-estimated? 


Thanks for your patience.

May be you should ask this as a separate question.