How to count people in a specific occupation with wtfinl

Hi,

I am currently working with CPS data, focusing on an occupation with a relatively small group of workers (e.g., school bus drivers in public schools). My goal is to see how the size of this workforce changes by year to better understand its labor dynamics.

Since this analysis uses monthly CPS data (from 2012 to 2024), I have been using the wtfinl weight, following the recommendation on the IPUMS website. Here’s a brief outline of what I’ve done so far:

  1. Created a dummy variable for whether an individual has this occupation using occ and ind (e.g., is_bus variable).

  2. Set the survey design with: svyset [pweight = wtfinl].

  3. Ran: svy: tab year is_bus to get the number of workers in this occupation by year.

For some reason, the number of people in the occupation is quite larger than what I have seen reported in the literature using ACS data (and I had expected CPS to show smaller numbers, since it is a monthly survey data.

Question: Does this approach seem methodologically reasonable to you?

I have checked around online and looked through past questions (i.e., link), but I did not find anything directly addressing this. Maybe the question is too basic for someone to have posted about before.

My plan is to move on to analyzing financial-related variables using earnwt, but before doing so I want to make sure that my current approach makes sense.

I’d really appreciate any suggestions, advice, or corrections you might have.

Thanks so much,
K
You are correct that WTFINL is the appropriate weight for most analyses of basic monthly survey (BMS) samples. Without more information on your analysis, I cannot provide exact troubleshooting, but I will share some information that may be helpful.

Most importantly, if you are using monthly survey data, but tabulating frequencies for an entire year, you will get an estimate that is approximately 12 times larger than is correct. The monthly CPS is a snapshot of the U.S. population in that month. Monthly estimates are accurate on their own (keeping in mind that labor force variables and others have seasonal trends, and so February will not look the same as July, for instance). Another important consideration is that it isn’t generally possible to obtain accurate estimates when your sample size is very small. If the unweighted number of public school bus drivers each month is very small, your estimates may not be accurate. You may want to use estimates that pool data from multiple time periods, or analyze a larger group of workers (e.g., all bus drivers).

If you want to use the BMS to calculate an annual estimate of the number of bus drivers, you can divide WTFINL by 12. This would allow you to see how the number of bus drivers (averaged over 12 months) changes each year. If you want to use the BMS to calculate monthly estimates, you can tabulate your binary occupation indicator by month, rather than year. This would allow you to see how the number of bus drivers changes each month.

Also, note that the CPS is a panel survey. Sampled households are interviewed monthly for four months, followed by a period of eight months out of the survey, and then four more months of interviews. This design allows you to study the same households or individuals over time. You can read more about the CPS design and panel structure here.

You may want to consider the possibility that many school bus drivers do not work as school bus drivers during the summer months when school is not in session. This could affect your estimates if a much smaller number of people work as bus drivers during some months, lowering the annual average.

The Census Bureau’s occupation categorization scheme changes frequently to reflect changes in occupations over time. This means that OCC codes change over time. You should make sure you have identified the bus driver occupation code correctly in each of the samples you are using. The 2011-2019 data use a different OCC coding scheme from the 2020-onward data. The same is true of the variable IND; the categorization scheme and therefore the codes change over time.

Thank you so much for your detailed explanation on how to use this weight appropriately.

I assume the same approach would apply when analyzing wages using earnwt. Is that correct?

May I also ask a follow-up question regarding survey settings? I have been reading several discussions online, but it seems there is no clear consensus on how to set up the CPS survey design. I plan to analyze the BMS at the individual level, but I am not sure whether I need to include strata or other variables in the survey design.

I would appreciate any suggestions or resources I could review on this. It would be super helpful for me as I work with complex survey data.

Thank you in advance, and I look forward to your response.

K

EARNWT should be used when analyzing any variables from the Outgoing Rotation Group (ORG), aka the Earner Study. You can read more about which weight to use when on this page about CPS weights. If you are using ORG data from multiple months pooled together, you will need to adjust EARNWT by dividing it by the number of months pooled together.

The Census Bureau suggests using replicate weights for supplement datasets to obtain empirically-derived standard errors that incorporate the survey design. IPUMS provides replicate weights for ASEC data from 2005 and later; we are working to add them to the other supplements. Replicate weights are not available for BMS data.

1 Like

This is very helpful, Isabel! Thank you for taking the time to explain it. I appreciate it.

I have a few follow-up questions. Suppose I pull data for three years, 2022–2024 (36 months), but I want to analyze bus driver wages by year. In that case, should I divide earnwt by 12 or by 36?

Also, I would like to adjust wages for inflation. It looks like IPUMS provides the CPI99 variable to deflate wages to 1999 dollars, but I don’t think it’s available for the most recent years. Do you recommend using another variable for this purpose? Or would it be better to bring in CPI data from another source?

I would appreciate any suggestions you might have.

Thank you,
K

You should divide the sampling weights by the number of samples you are pooling together. So if you pool 36 samples together in your analysis, you should divide the weights by 36.

IPUMS CPS has a new feature that allows you to adjust the monetary values of variables measured in dollars. This means you can adjust income variables for inflation automatically when you create your extract. You can read more about this feature on this page.

1 Like

Thank you for your help with my question. I am working with the earnwt variable in CPS data and am a bit confused. I tried dividing earnwt by the number of months pooled (36 months) to adjust the weight, but the results using the discounted weight (earnwty ) were identical to those using the original earnwt . Here’s the code I used:

gen earnwty = earnwt/12
svyset [pweight = earnwty]
svy: mean hourwage2 if is_bus == 1 & is_public == 1 & is_educ == 1 & hasjob == 1

Also, the mean hourly wage for bus drivers in the public education sector came out to about $5 per hour, which seems unrealistically low.

I suspect I am missing something in the process. Sinceearnwt is for the Outgoing Rotation Group, do I need to restrict the data to specific months (e.g., MIS 4 and 8)? Any guidance on using earnwt for this analysis would be appreciated.

Thanks a ton!
K

Code review is beyond the scope of IPUMS User Support, but I’m including some information and considerations in a numbered list below that may help you with your work.

1. Modifying weights to account for pooling samples will change estimates of frequencies and those directly related to frequencies. However, modifying weights to account for pooling samples will not change estimates like means or regression coefficients. You should not expect to see any changes in your estimations of means after making linear operations on weights.

2. The ORG/Earner Study includes only civilians age 15 and older who are currently employed as a wage or salaried worker (that is, not self-employed). Only respondents in an outgoing month in sample (MISH=4 or 8) are part of the ORG/Earner Study. If your analysis includes ORG variables, such as HOURWAGE2, it should only include respondents in the universe of the ORG (and of the variable, if there are additional restrictions on the variable’s universe).

3. Make sure you are treating NIU codes properly (i.e., not as dollar amounts). NIU codes are not numerically meaningful and do not represent dollar amounts. You can replace NIU codes with missings (with “.” in Stata).

4. Many income variables, including HOURWAGE2, are top coded. You can find information on the NIU code and top codes in the codes section of the variable.

5. Beginning in April 2023, hourly earnings were rounded and topcodes were changed as a privacy protection measure. HOURWAGE2 imposes these criteria on pre-April 2023 data (including the 2023 ASEC) to provide users with comparable hourly earnings over time. See the Census Bureau’s user note for more information on the new privacy protection measures. HOURWAGE reports un-rounded hourly earnings for pre-April 2023 data (including the 2023 ASEC) only.

6. Not all school bus drivers for public schools are direct employees of the public schools or districts where they work. They may be employees of private companies that contract with schools or school districts to provide bussing services. I assume you are restricting your analytical sample with CLASSWKR; doing so may reduce your sample size and exclude workers you are interested in.

7. If you are newer to microdata analysis and/or working with IPUMS data, I suggest working through some of our data training exercises to get practice using our data. These exercises can be very helpful to users who are having trouble perfecting their analyses and troubleshooting issues.

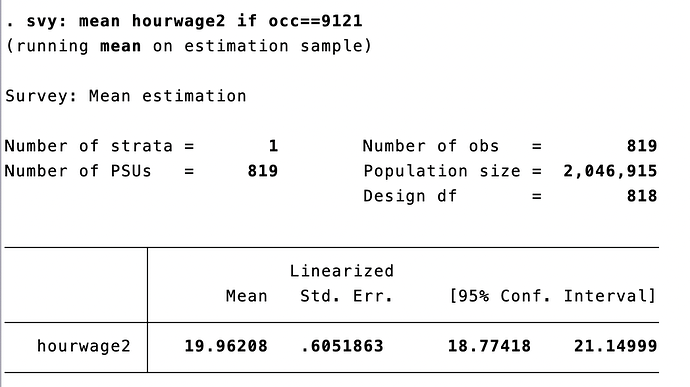
I did a quick estimation of the mean value of HOURWAGE2 among school bus drivers (OCC=9121) using all 12 BMS samples from 2023. The estimated mean is $19.96, which seems reasonable to me.


[Alt text: Image is a screenshot of Stata output showing a weighted mean of IPUMS CPS variable HOURWAGE2]

1 Like

Isabel,

Thank you for sharing this incredibly useful resources! I will start working on the code exercises from IPUMS. I did not know that IPUMS offered this resource, and I am sure it will give me more ideas on how to work with CPS data.

In addition to following your resources, may I please confirm my understanding from your post?

  1. My understanding is that whenever I want to work with the Earner Study group, I should use the data where MISH == 4 | MISH == 8. Basically, I should download MISH variable to define the Earner Study group. Am I right about this?
  2. In your example, you pulled 12 months of data from 2023 and calculated the mean as $19.96. This number makes sense to me as well. However, since we pulled data for 12 months, don’t we need to adjust using the multiplier from earnwt? In other words, should we discount this number by 12? If so, the hourly wage would drop to $1.63, which seems incorrect.

I would greatly appreciate it if you could help me clarify these two points. Also, thank you for your suggestion on classwkr. I do use this variable to define public and private work, and your point is valid—I will definitely incorporate it into my analysis.

Thank you so much, and I look forward to learn more from your response.
K

You do not need to use the variable MISH to restrict your analysis of Earner Study variables to Earner Study respondents. The variables in the ORG variable group are already restricted to being defined for Earner Study respondents; those who are not eligible for these questions will be assigned NIU values. Just make sure that you are appropriately dealing with NIU codes as described in my last post to exclude people who were not in the Earner Study from your analysis but who have NIU values (e.g., 999.99) for Earner Study variables. If you have cleaned your data you do not need to filter on MISH (and doing so will not change your results). The variable ELIGORG identifies those who are eligible for the Earner Study.

When analyzing data from multiple pooled BMS samples, you need to divide the value of the weight variable by the number of pooled samples to obtain accurate frequencies or estimates derived from frequencies (e.g., In Stata I would do this using something like the following code: gen earnwt_pooled2023 = round(earnwt/12)). You should not divide the estimate itself by anything.

1 Like

Hi Isabel,

Thank you for following up on my request. I really appreciate it. What you explained makes perfect sense, and I agree that IPUMS makes working with CPS data much more manageable.

I followed your suggestion on discounting earnwt by creating a new variable using earnwt/12. I used the same dataset as in your example (BMS 2023) and restricted the observations to OCC == 9121. When I compared the results using the original earnwt provided by IPUMS, I obtained results similar to those you shared previously (attached 1).

However, when I applied the yearly weight (earnwt/12), the results remained the same (attached 2).

This does not seem correct, as I would have expected the values to be approximately one-twelfth of the original.

Do you have any thoughts on what I might be missing in this scenario? I would appreciate any observations or suggestions you may have.

For context, I tried a similar approach previously with wtfinl, and it worked as expected. I am not sure why earnwt is behaving differently.

Best regards,
K

Modifying weights to account for pooling samples will change estimates of frequencies and those directly related to frequencies. However, modifying weights to account for pooling samples will not change estimates like means or regression coefficients. You should not expect to see any changes in your estimations of means after making linear operations on weights.

Isabel,

Thank you so much for your explanation, It really cleared up a point that had me stuck for a while. I just have one more clarification. When you mentioned “anything related to frequency,” were you referring to functions such as count, tab, or other similar frequency-related functions?

Best regards,
K

In data, a frequency is the number of times something occurs. For example, the number of person records in your dataset that meet specified criteria is a frequency.

IPUMS User Support is available to answer questions related to IPUMS data and our sites. If you have any additional questions specific to IPUMS data we would be happy to help you. You may find it useful to review some resources on statistics and data analysis, either online or at your institution or workplace if applicable. Understanding different types of data, analysis, and estimates will help you better work with IPUMS data. In a previous post I linked to our data training exercises.

1 Like

Hi Isabel,

Thank you so much for your detailed explanations to all of my questions. I appreciate your clarity and guidance. Your responses have been incredibly helpful and will definitely be valuable as I continue working with IPUMS data.

Cheers,
K

Hi @Isabel_Pastoor ,

Thank you again for all the guidance you’ve shared earlier. Your suggestions have been very helpful, and I’ve been able to make a lot of progress on my project because of them.

I have one more thing I would like to check. Previously, when I tabulated data by year, I adjusted the weight as wtfinl_year (where wtfinl_year = wtfinl/12) to estimate the number of bus drivers and other occupations in each year. Now, I’d like to analyze the dataset as a whole to examine the composition of race within each occupation.

My question is: do I need to further adjust the weights by dividing by the number of years (i.e., wtfinl_all = wtfinl/(12 * number_of_years))?

I actually went ahead and I tried both approaches. I found that:

  • Using the yearly weight (wtfinl_year), I got the total count summed correctly across years.
  • Using the all-years adjustment weight (wtfinl_all), the results seemed to reflect an average across years, which no longer summed to the yearly total.

Do you have any suggestions or best practices on which approach is more appropriate for analyzing composition across the full dataset? I would greatly appreciate your advice.

Best regards,
K

You should divide the sampling weights by the number of samples you are pooling together. One month of BMS data is one sample. One ASEC is one sample. If you are pooling together 24 samples, for example, you should divide the sampling weights by 24.

1 Like

Thanks for confirming, @Isabel_Pastoor . Just to be sure I’ve got it right: using the pooling weight gives an average across multiple years, correct? And if I want the yearly aggregate count, I should still use wtfinl/12, right?

I appreciate your suggestions/advice on this.

Best regards,
K

Weighting your data ensures your estimates are representative of the sampled population. When you pool multiple samples together, you are using the data from all of those samples. When you divide your sampling weight by the number of samples pooled together, this ensures that estimates of frequencies are not erroneously inflated.

1 Like