children_under_13_100FPL.pdf (404.7 KB)
Hello! We use CPS estimates of children under 13 years old living at or below 100 FPL to measure the inclusiveness of state child care programs. We have noticed that the count of children under 13 years old and below 100 FPL has declined substantially since around 2010 for a handful of states, with some experiencing a reduction of more than half by 2022. I have attached trend graphs for select states for your reference. Are declining trends expected?
Delaware, in particular, has such a low estimate in 2016-2020 that our inclusion measures show more than 100% of children under 13 years old at or below 100 FPL in the state received child care.
Thanks for your help in advance!
The CPS is not typically used to produce state-level estimates of poverty in part due to the relatively large variance for these types of estimates. The Census Bureau’s Poverty in the United States report includes the following note (on page 53):
The Census Bureau recommends that people use the CPS ASEC for timely and thorough estimates of national poverty. However, the Census Bureau produces other data that are appropriate for subnational areas and longitudinal analysis. The American Community Survey (ACS) and the Small Area Income and Poverty Estimates (SAIPE) program can be used for subnational poverty estimates, while the Survey of Income and Program Participation (SIPP) provides monthly and longitudinal estimates.
IPUMS USA provides data from the American Community Survey and the U.S. census through 2023. You can estimate poverty rates using these data with the variables CBPOVERTY and POVERTY, which differ substantially. CBPOVERTY is the Census Bureau’s original poverty status measure and is based on Census Bureau family unit definitions, while POVERTY is an IPUMS-created variable that relies on our own definitions of family units. You can read more about the differences in these variables by clicking the links to the variables. See also the Supplemental Poverty Measures available from IPUMS USA, such as SPMPOV, an alternative indicator of poverty status that incorporates the value of tax and transfer benefits not included in the official poverty measure. See this page for more information about measuring poverty in IPUMS USA data.
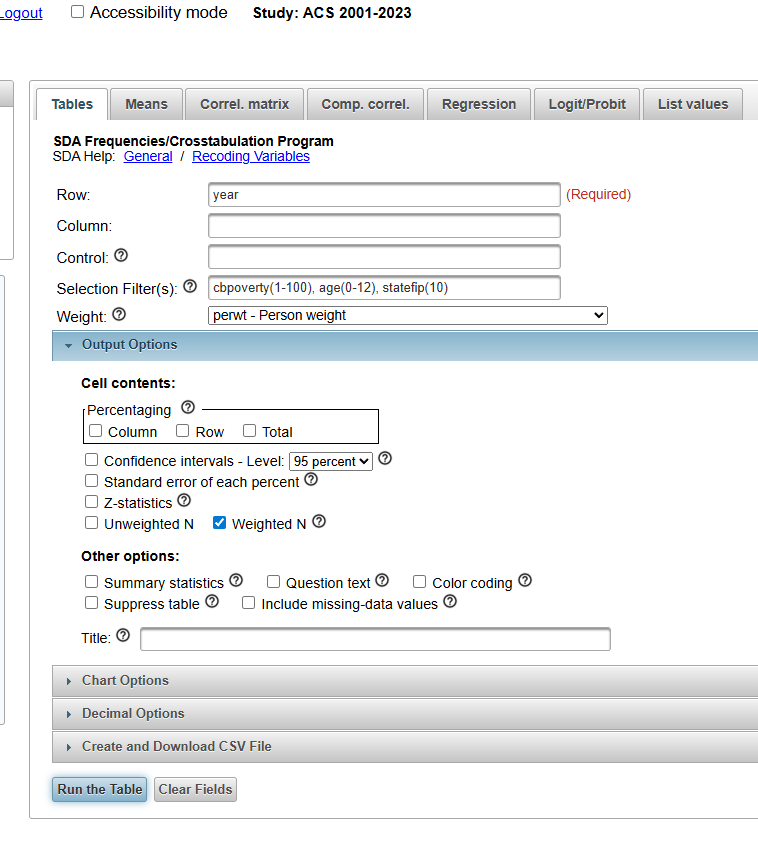
While studying poverty at the state-level with CPS data is not recommended, I was able to observe a similar decline by reproducing your analysis using ACS data from IPUMS USA. In the screenshot below, I use the IPUMS USA Online Analysis Tool to produce annual estimates of the number of children under 13 living in families at or below the federal poverty line using the Census Bureau’s family definition in CBPOVERTY. When I run this table, I find that the estimated number falls from 30k in 2010 to 22k in 2023. Additionally, the Poverty in the United States report linked above reports a similar national decline in the number of children under 18 living under the poverty threshold from 16.3 million in 2010 to 11 million in 2023 (see Table A-3 on page 22).
Many thanks for your help, Ivan. The information and resources you’ve shared are very helpful.
@Ivan_Strahof, I have a follow-up question about using ACS data to estimate state-level poverty. We recently switched from using IPUMS CPS to IPUMS USA data for calculating poverty measures.
With CPS ASEC, income data are collected for the previous calendar year, so we previously used the Official Poverty Measure thresholds for that year to determine the poverty status of families.
However, ACS surveys collect income data for the previous 12 months, which can span across two calendar years. Does IPUMS have any recommendations on whether we should use poverty thresholds for the survey year, the previous year, or use some other approach?
Thanks!
Thresholds for the Official Poverty Measure (OPM) are updated annually based on inflation reported in the CPI-U. When assigning poverty status in the ACS microdata (available via IPUMS USA in the variable CBPOVERTY), the Census Bureau uses the survey year’s thresholds. Similarly, the variable that reports OPM status based on IPUMS family identifiers (POVERTY) also applies the survey year’s inflation adjustment factor to the baseline threshold (see the user note on poverty definitions in IPUMS samples).
The Census Bureau does offer a within-year adjustment factor that you might consider (see our user note on income standardization). The purpose of this is to adjust dollar amounts to the amount that they would have been had they been earned entirely during the calendar year, allowing you to directly compare these amounts to the survey year’s poverty threshold. However, since the month of survey is not provided with the public microdata, only a single annual adjustment factor is available. Given that a constant adjustment factor cannot adjust dollar amounts to calendar-year dollars, we leave the decision of whether to use this factor to individual researchers.
Thank you so much @Ivan_Strahof. This is very helpful.